Breadcrumb
- Home
- Labs
- Advanced Labs
- Astronomical Redshift
- Part 2: Measuring Redshifted Wavelengths
Part 2: Measuring Redshifted Wavelengths
Quasar Spectroscopy
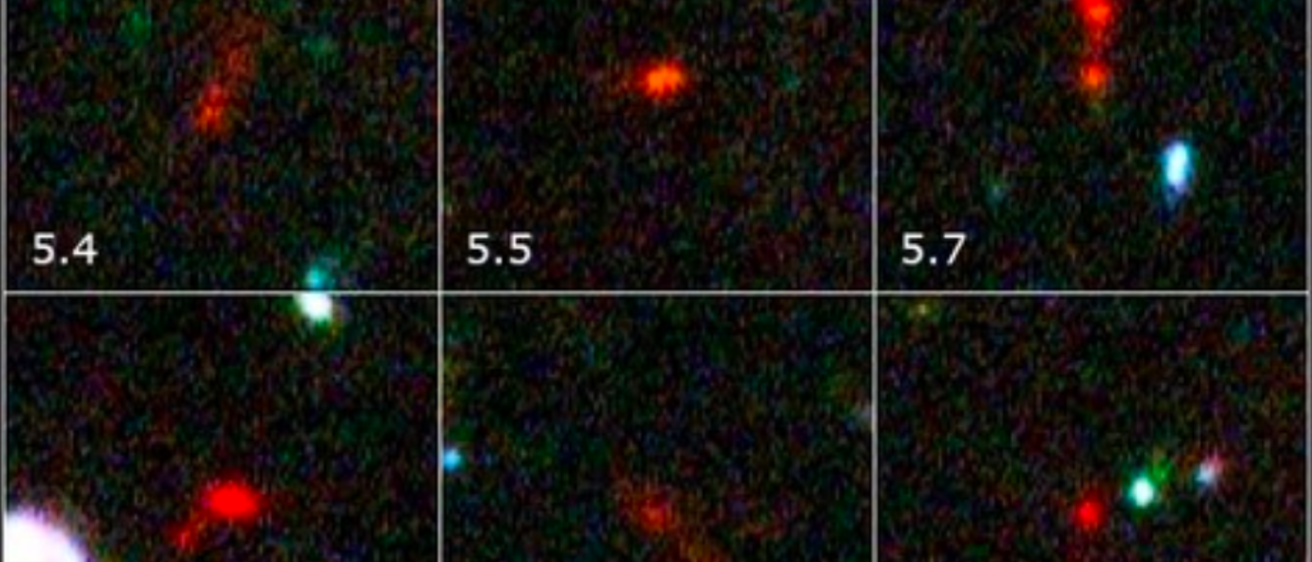
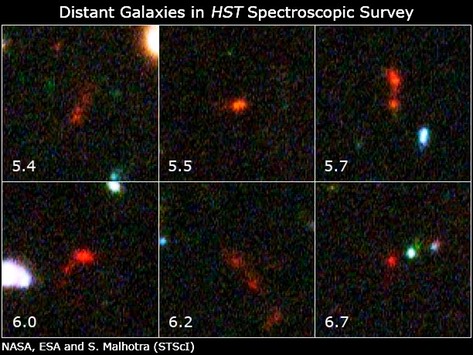
Spectra of multiple quasars have been obtained with the Sloan Digital Sky Survey (SDSS). Quasars are extremely distant, luminous galaxies that have spectral lines that are Doppler redshifted because of Universe expansion, resulting in the quasars traveling away at high velocities (example images of some quasars are shown below, the red features at the center of each panel). Astronomers calculate how fast these objects are moving by taking a spectrum of their light which gives the redshifted wavelengths of their spectral lines, which can then be compared to the lines' known rest wavelengths.

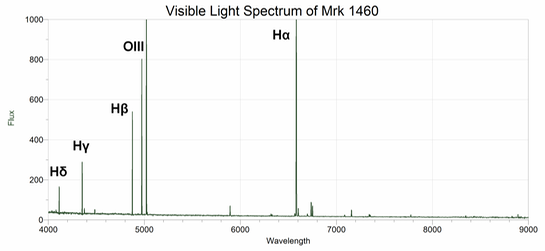
The spectra of most galaxies (including quasars) are dominated in the optical by two types of emission lines: hydrogen lines (the Balmer series) and oxygen lines. In the spectra of quasars, a pair of strong lines caused by oxygen molecules that have been doubly ionized (OIII) can be found at 500.7 nm and 495.9 nm. A second pair of strong lines (OII, singly ionized) can be found at 372.7 nm and 373.0 nm. Examples of these galaxy features can be seen labeled in the spectrum of the galaxy Mrk 1460 shown below. (Mrk 1460 is very close to the Milky Way and therefore does not have a detectable redshift; the shift is so small that it can be ignored. The redshift of Mrk 1460 is of the order z = 10-4.) The x-axis of the plot is in Angstroms; astronomers sometimes prefer to use this unit for wavelength rather than nanometers. An Angstrom is 10-10 m , one ten-billionth of a meter or one tenth of a nanometer. Use this spectrum to help you identify the emission lines of the spectra of the quasars in your lab questions. Remember that the ordering and relative spacing of of these lines will not change; for example, Hα will always be at a longer wavelength than Hβ, and Hγ will be at a longer wavelength than both Hδ and Hε.

Determining the Age of the Universe from Spectra of Quasars
Each lab group will be responsible for a quasar. In this lab, where useful, note that 1 pc / Myr = 1 km / s, where 1 Myr = 1 million years. The quasar data can be opened in LoggerPro, and is found under LabImage → Spectra → SDSS. Your instructor will assign you a quasar and show you how to open the data in LoggerPro.
Using this data and Hubble's Law, you will determine the velocity of the quasar and its distance. You will then calculate Hubble’s constant using the spectra assigned to the class.
Questions
- Draw the spectrum of your quasar and identify the emission lines. Your spectrum may have OIII lines in it, so be sure you don’t confuse them with the hydrogen lines. In some cases, the noise level may be too high to identify Hδ or Hε. Make sure to label the axes.
To begin to calculate the redshift value of your quasar, identify 5 emission lines (Balmer or O III) in your spectrum and record their rest and observed wavelengths in the table. Fill in the table with the rest wavelengths from Part 1 (Balmer lines) or the wavelengths listed above (OIII lines). Then record the observed redshifted wavelengths from the spectrum of the quasar which you did in Question 1 by observing the emission lines and finding their peaks. Subtract the two values and record the change in wavelength. Calculate the redshift z for each emission line; we calculate the redshift of galaxies by the relationships

where Δλ is the change in wavelength, and λrest is the rest wavelength. Then calculate their redshift value z. Be careful with wavelength units.
Calculate the average redshift value, then find the velocity of the quasar in km/s using the formula z = v/c, where v is the velocity, c is the speed of light, and z is the redshift.
In LoggerPro, make a plot with the distance (Mpc) on the x-axis and the velocity (km / s) on the y-axis using the quasar data from all of the lab groups in your class. Sketch your plot here, and find the slope of the best-fit line and use it to determine Hubble’s constant. Then compare your experimental estimate with the actual known value using the Percent Error Formula.
Compare your distance estimate with the actual value given on the worksheet using the percent error formula.
- With your value of the Hubble constant, compute the age of the universe (the "Hubble Time", t = 1 / H0) and compare it with the accepted value (13.8 billion years) using the Percent Error Formula. Is the value you obtained for the Hubble time different? Why do you think this is so?