Resources: Worksheet (.docx), Worksheet (.pdf), Calculators (or Wolfram Alpha), Stellarium Web
Terminology: Angular Resolution, Contrast, Histogram, Small Angle Formula
Tutorials: Importing Images into MaxIm, Coordinates in MaxIm, Producing Color Images
The Telescope System
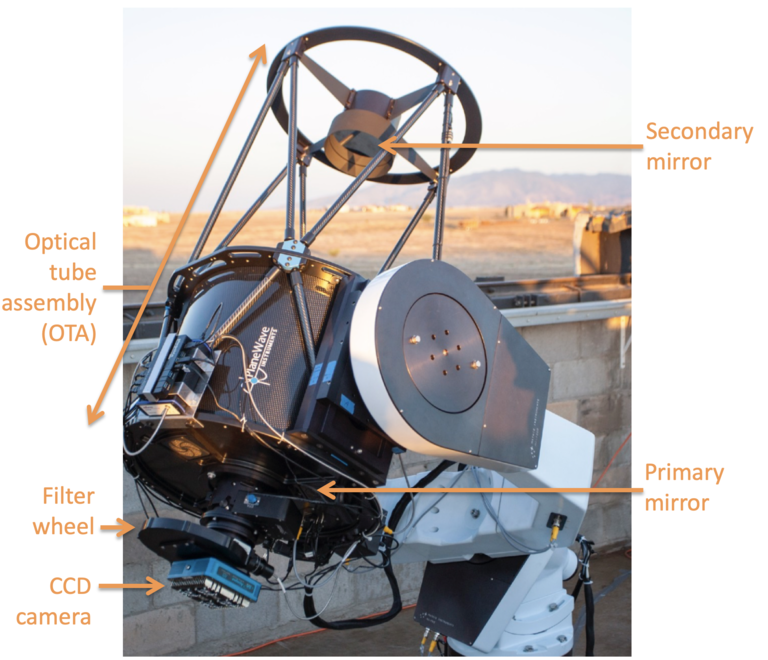
Most research-grade telescopes are typically reflectors. Light from the night sky enters the optical tube assembly and hits the primary mirror, which bounces off and then encounters the secondary mirror before bouncing off again and focusing onto the image plane of a CCD camera at the back of the telescope. The camera is made up of many small pixels that each collect light from the sky. The pixels in the camera have a pixel or plate scale that tells how many arcseconds of the sky falls onto each pixel. The smaller the pixels, the finer the detail of the images of the sky the telescope is trained on. The larger the CCD chip is (the more pixels there are, whether the pixels are small or large) the more angular size of the sky is captured in an image; the larger the field-of-view is. The University of Iowa has one such research setup at the Iowa Robotic Observatory at Winer Observatory in Sonoita, Arizona, as is pictured here. In a robotic observatory, prepared software runs the telescope through a list of observations for a night (called a schedule) completely independent of human observers controlling it. For this lab, students may queue observations for the schedule for Gemini, collecting their own imaging data from the Iowa Robotic Observatory. Or students may employ archival data. Some of the archival data available for use may come from an earlier iteration of the robotic telescope at the Iowa Robotic Observatory which was named Rigel.
Imaging Terminology
Keep in mind the following terms as you use imaging data taken by an astronomical camera:
- Pixels: Small squares of metal in a camera that capture light together on a chip to form an image. An individual pixel can only report one number for the amount of light that it has captured during an exposure (single picture).
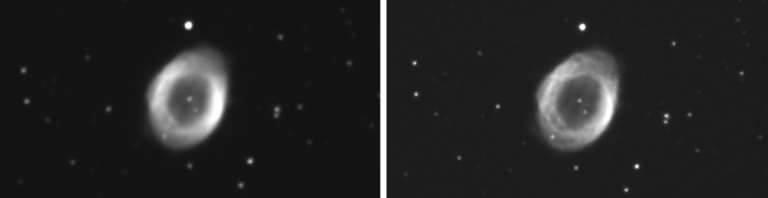
Angular resolution example. Left: 1.3 "/pixel, Right: 0.5 "/pixel. Image credit: Ceravolo Optical Systems, Ring Nebula Angular resolution: The amount of detail that a device, such as a CCD camera, can capture. A large angular resolution (a large number of arcseconds per pixel (" / pix)) means that the detail is poor, while a small angular resolution (a small number of arcseconds per pixel (" / pix)) means that there is a lot of detail recorded. Pixel or plate scales are angular resolutions. For example, as seen to the right with the two images of the Ring Nebula, the image at the far right has greater detail and a smaller angular resolution (it is less blurry).
- Magnification: The amount that an image has been enlarged, or zoomed in. Increasing the magnification does not increase detail. It may reveal detail that was too small to be seen before, but it will never create detail that was not already present in the image to begin with.
- Angular size: A segment or portion of the sky, an angle of the sky in question.
- Field-of-view (FOV): The amount of surroundings you are able to view, the area that your vision is restricted to, usually by a physical barrier (binoculars, a window). Fields of view are expressed in angular sizes.
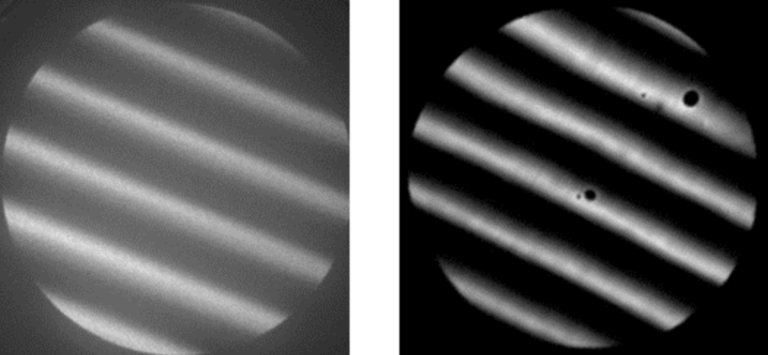
Contrast example. Image credit: Goethe
University Frankfurt, Silicon/Palladium sampleContrast: The amount of difference between the individual colors present in an image (even in, and especially in, a greyscale image). How quickly an image changes from one color to another. See the comparison pictures at right (the image content doesn't matter, just look at the contrast difference between the two otherwise identical images; the image on the left of the two has a lot less contrast).
Filters
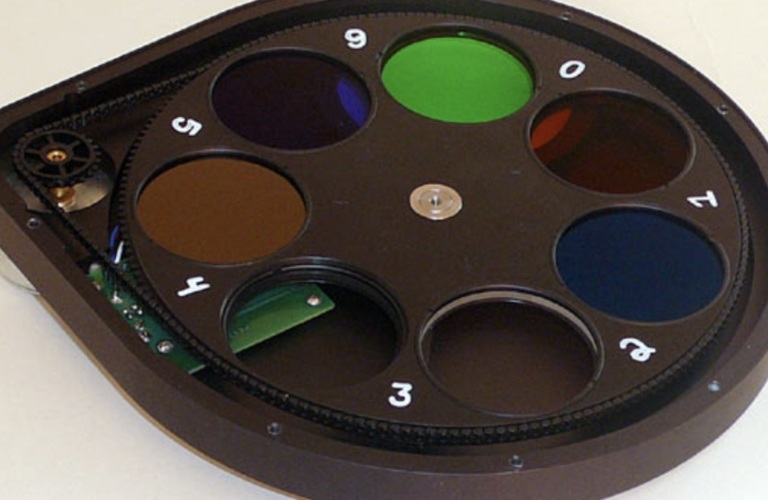
Most astronomical cameras, including the one at the Iowa Robotic Observatory, are partnered with a filter wheel that is attached to the camera to block out certain kinds of light (such as the filter wheel seen to the right). These filters can allow one to see how bright objects are in different colors, or to look at the specific spectral line of a common element such as hydrogen. Look at the example image below; images of a nebula were taken using different filters. On the left, you can see the image taken in blue, then green, then the red regime of the electromagnetic spectrum. Note that each image shows different properties and structure of the nebula, but it is meaningful to combine all the images to produce a color image, which is the image of the nebula below.
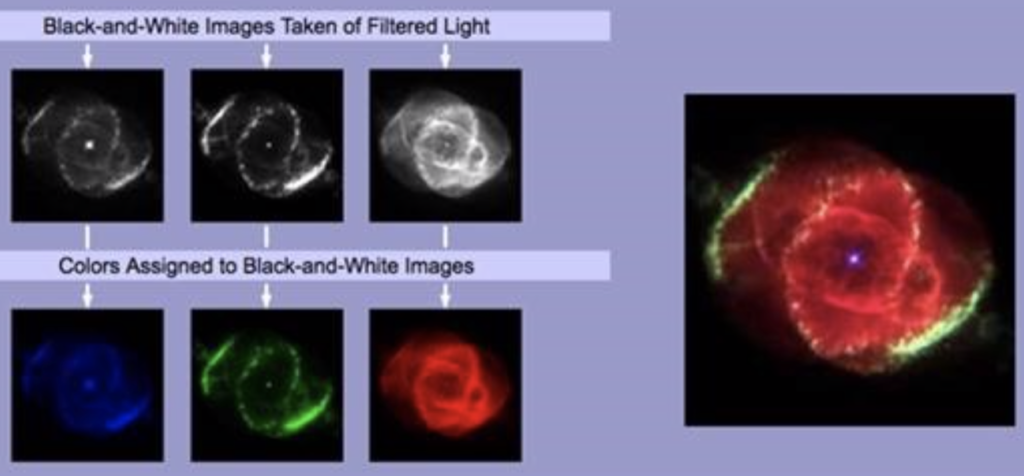
While having a color image is helpful to understand properties of the object and they are beautiful to look at, we call these images false-color images. The colors don’t represent the true appearance of the object, instead we have assigned color filters to help bring out features. In many cases, the red filter may be a red hydrogen Alpha filter (H-alpha); tracing an atomic transition, not a real color that you would see with your eyes. Similarly, the green filter might trace O III (twice-ionized oxygen), showing the locations of an ionized state of oxygen gas. It is convenient to use colors to map out these features, but such a galaxy isn’t actually green.

Learning Goals: For students to familiarize themselves with conducting basic image analysis using the powerful astronomical software package MaxIm DL, and then to apply those skills to do an analysis of observational images to answer a simple science question.