Breadcrumb
- Home
- Labs
- Advanced Labs
- Hertzsprung-Russell Diagram and Star Clusters
Hertzsprung-Russell Diagram and Star Clusters
Resources: Worksheet (PDF), Worksheet (word document)
Equipment: Rulers
Terminology: Apparent Magnitude, Color Index, Spectral Type
Demonstrations: H-R Diagram Explorer
Brightness, Luminosity, and Magnitudes
When you observe a star with a telescope, you are actually measuring its brightness, not its luminosity. The luminosity (L) and brightness (B) are related by the Inverse Square Law

where d is the distance to the star. Ancient astronomers measured the brightness of stars by ranking them by visual appearance. In the magnitude scale, which is logarithmic, the brightest stars have the smallest numbers, while the dimmest stars have the largest numbers. For example, a star with a magnitude of -1 is brighter than a star with a magnitude of 2.
We use two magnitude scales to describe the brightness of stars. The first is apparent magnitude, which is what is generally measured with a telescope. The second is absolute magnitude, which is how bright the star would be if it were at a distance of 10 parsec. The two scales are related by
M = m - 5 log10 (d/10)
where M is the absolute magnitude, m is the apparent magnitude, and d is the distance in parsecs.
Color Index
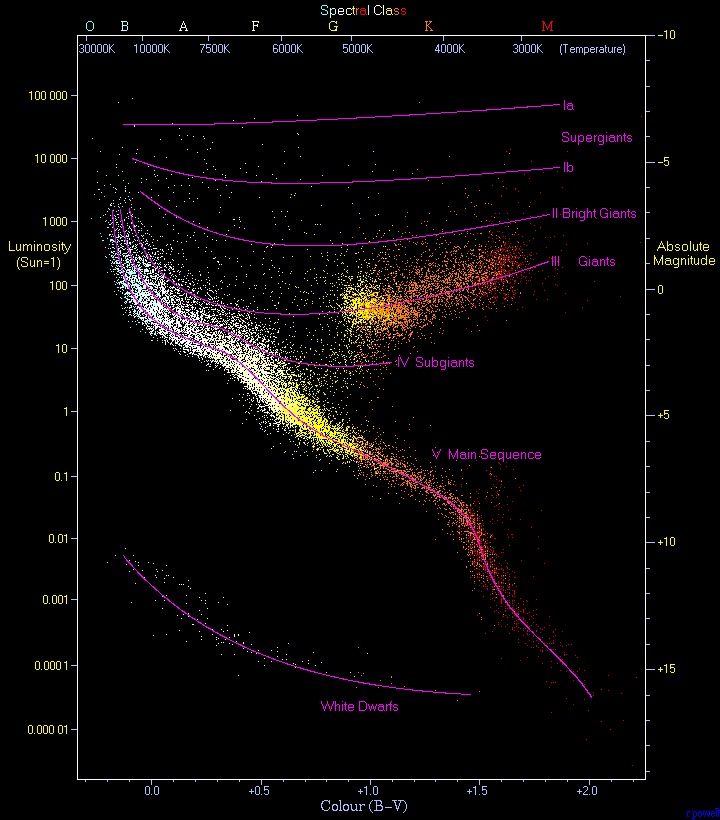
The color index is a simple numerical expression that determines the color of an object, which in the case of a star gives its temperature. To measure the index, one observes the magnitude of an object successively through two different filters, such as U and B, or B and V, where U is sensitive to ultraviolet rays, B is sensitive to blue light, and V is sensitive to visible (green-yellow) light (see also: UBV system). The difference in magnitudes found with these filters is called the U-B or B–V color index, respectively. The smaller the color index, the more blue (or hotter) the object is. Conversely, the larger the color index, the more red (or cooler) the object is.
Spectral Types and Stellar Classification
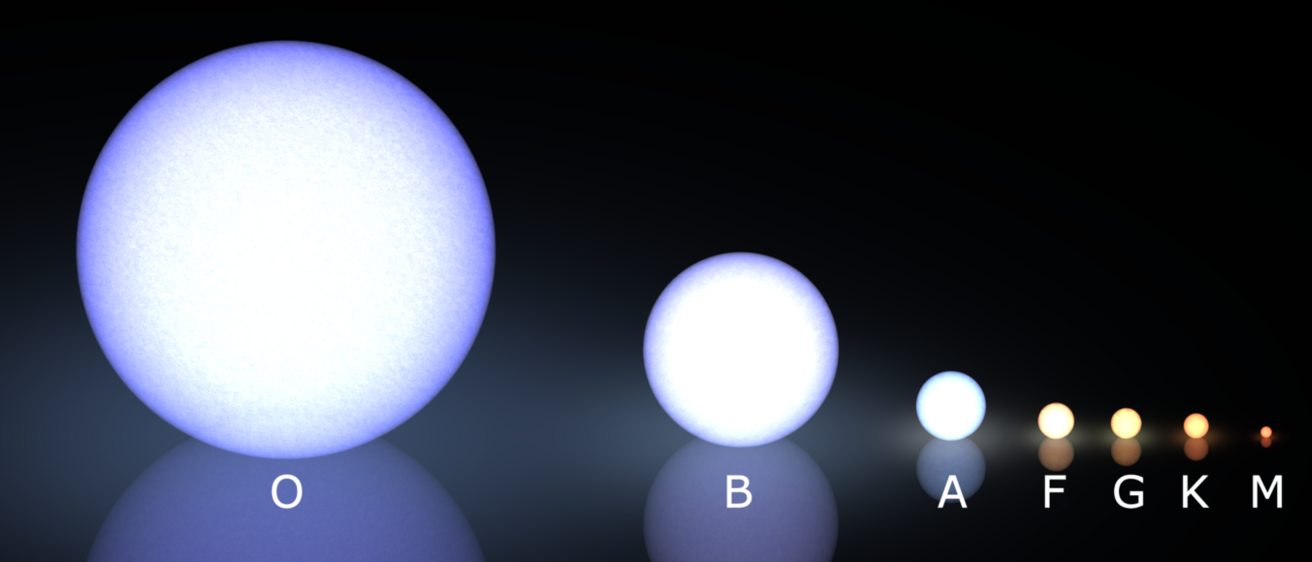
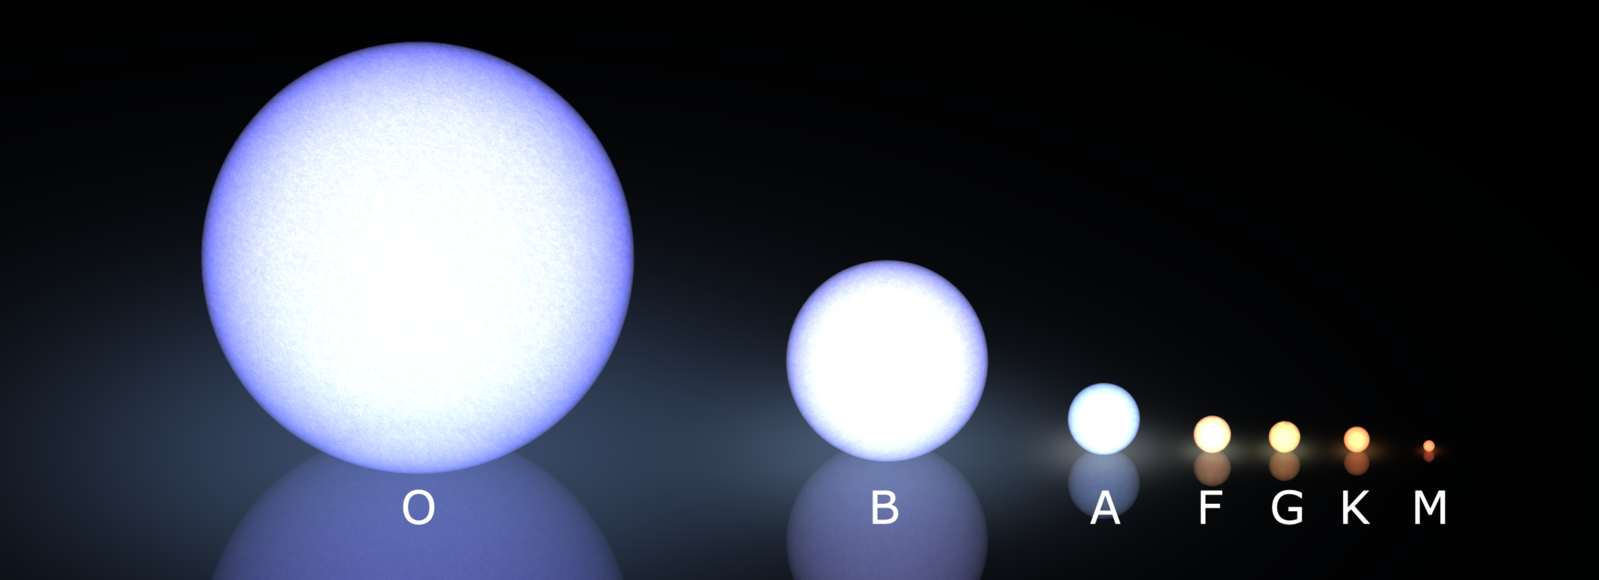
Stars are classified by their temperatures and luminosities. We use the Morgan-Keenan scale for spectral types, categorizing stars into either class “O”, “B”, “A”, “F”, “G”, “K”, or “M”. The spectral class of a star denotes its temperature, with O stars being the hottest and most massive, and M stars being the coolest with the lowest mass. The spectral types of stars are further subdivided using a scale from 0-9, where 0 is hotter than 9. For example, a O8 star is hotter than a O9 star, and both are much hotter than a G0 star.


Hertzsprung-Russell Diagrams
