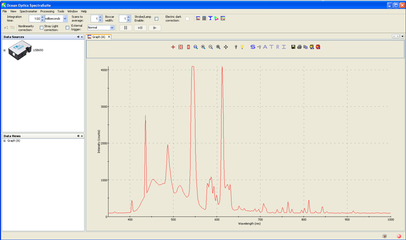
SpectraSuite is a spectroscopy software program which can be used to capture and analyze spectral data from light sources with the use of a spectrometer. You will use a similar program, RSpec, later in the course to analyze the spectra of stars, planets, etc.
SpectraSuite can be found through the start menu under ‘Ocean Optics’ or through a desktop shortcut. If the spectrometer is already correctly connected to the computer, you should see a spectrum displayed as soon as the program loads. The spectrum will change in real time as you move the receiving end of the fiber optic cable.
There are a number of options and settings that can be changed in SpectraSuite which will affect how data is collected and displayed. In the top left corner, are three fields labeled; Integration Time, Scans to Average, and Boxcar Width.

Integration Time will determine the period of time over which the light detected by the CCD is summed (like setting the shutter speed of a film camera). The longer the integration time, the more light is absorbed and the larger the peaks in your spectra will appear. Using a high integration time can be useful for analyzing faint sources, however if the integration time is too high (on the order of a second or higher) it will cause the spectra to appear jumpy and cause the software to lag. For the purposes of this lab you shouldn’t need an integration time higher than 100 milliseconds, and may even need to lower it further.
Scans to Average determines the number of spectral acquisitions the spectrometer driver will collect before averaging the results and sending them to the SpectraSuite. Increasing the number of scans will reduce the amount of noise in your spectrum and create a smoother plot, but as with the Integration Time, if the field is increased too much it will severely lag the software.
Boxcar Width, like the Scans to Average feature will average sets of spectral data. Instead of averaging the data from a single point though, setting the Boxcar Width will result in the data of multiple, adjacent points on the CCD being averaged. This will produce a much smoother plot, but if the number selected is too high it will lag the software and will also severely reduce the spectral resolution of the plot – making it difficult to identify fine features like emission lines.
Below these three options are three buttons – Pause Selected Acquisition, Perform Single Acquisition, and Restart Selected Acquisition. These buttons function like the pause, step forward, and play features on a video player. Pausing or Restarting Acquisition will ‘Pause’ or ‘Play’ the live spectra feed. Perform Single Acquisition will produce a single, still spectrum.
The buttons displayed within the graph area allow you to zoom in and out or to manually or automatically scale the graph. You can also save a spectral plot or overlay spectral data from a previously saved plot. There is also a screen capture option under the file tab in the upper left corner of screen.
