Breadcrumb
- Home
- Labs
- Advanced Labs
- Astronomical Redshift
Astronomical Redshift
Main navigation
Resources: Worksheet (PDF), Spectra, Ocean Optics Spectrometer, Vernier Spectrum Tube Carousel, Discharge Tubes, Power Source, USB Cord, Fiber Optics Cord, Quasar Spectra
Terminology: Percent Error Formula, Quasar, Emission Lines, Balmer Lines, Doppler Effect, Redshift
Doppler Shift and Redshift
The Doppler Effect describes the change in the wavelength and frequency of waves emitted by a source which is in motion relative to the observer. As the source moves, each peak in the waveform it produces is emitted from a position which is closer or farther away (depending on whether the source is moving towards or away from the observer). Because of this, the wavelength shifts and the frequency at which peaks arrive at the observer changes. The value of the shift is dependent on details of the material the waves are traveling in. Doppler shifts from the Doppler effect can be seen not only in sound waves (like the change in pitch of a passing vehicle), but in light waves as well.
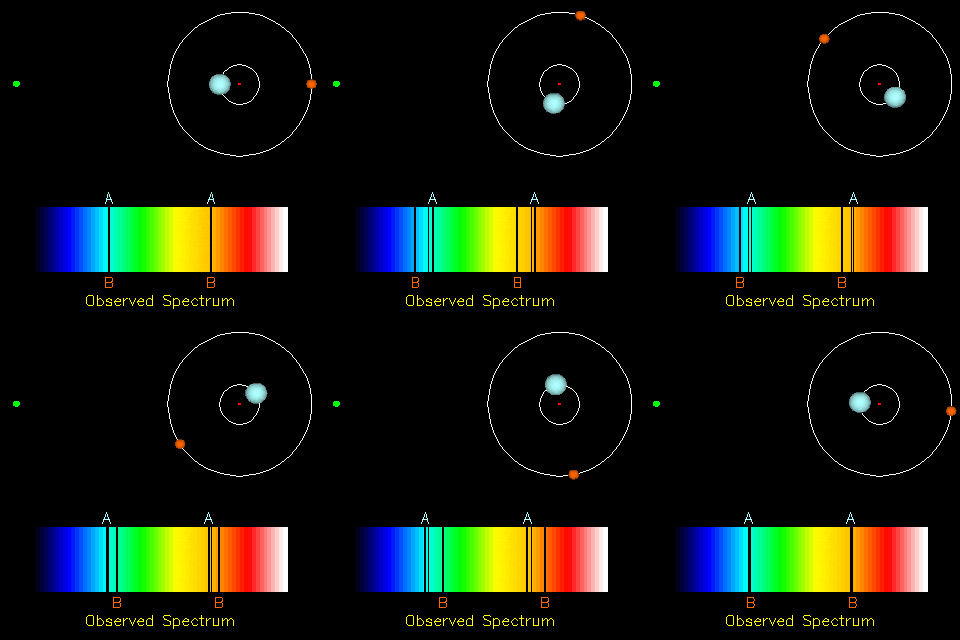
As an object emitting light moves towards an observer, the light reaching the observer will shift towards the blue end of the spectrum, decreasing the wavelength of the light and increasing its frequency. This is called blueshift. If an object emitting light recedes away from an observer, the light reaching the observer will shift towards the red, increasing the wavelength and decreasing the frequency. This is called redshift. The light shifts from its rest wavelength toward these bluer or redder wavelengths. For example, see the animation to the right. The observer is located a the green point on the left. The two stars seen on the right orbit one another. As the star labeled B moves toward the green point observer, its B spectral lines appear in the blue wavelengths of the spectrum. As it receds from the observer, its absorption lines move to the red, becoming redshifted instead. The star labeled A and its A absorption lines behave in the same manner, shifting to the blue when moving toward the observer and shifting to the red when moving away.
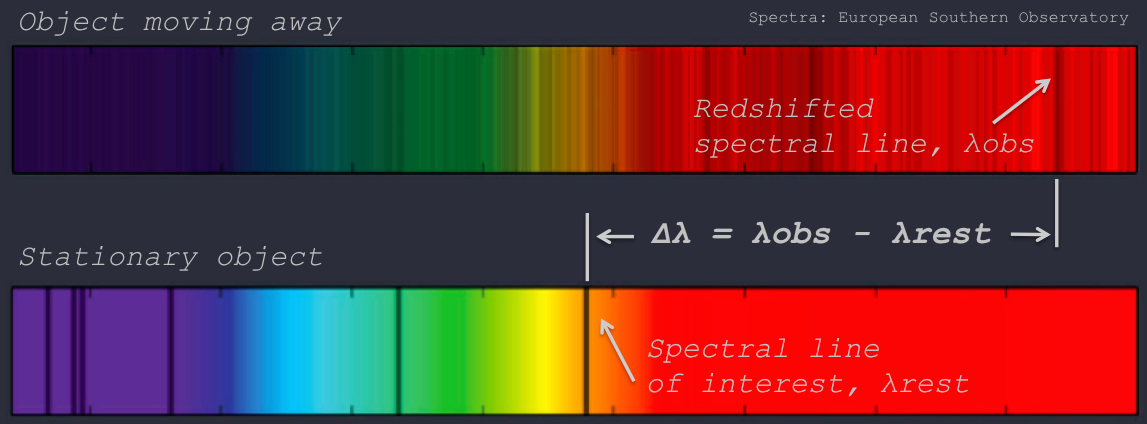
When the velocity of the object is small compared to the speed at which the waves propagate, the magnitude of this blueshift or redshift, called z, is proportional to the shift in wavelength Δλ (see above) over the rest wavelength, λrest. Furthermore, the magnitude of this blueshift or redshift z is proportional to the object’s velocity v over the velocity at which the waves travel (the constant c for light waves) giving the equation z=v/c. These equations are given below. Doppler shifts in the spectrum of an object (like a star or galaxy) can usually be determined by comparing the wavelengths of features in the object’s spectra, like absorption and emission lines, to expected wavelengths for certain elements and chemical compounds.

As motion is relative, redshift and blueshift can also occur when an observer is moving instead of the light emitting object. If the observer moves toward the object, it appears blueshifted, and if the observer moves away, a redshift is observed. Astronomical redshift and gravitational redshift are related phenomena that occurs not because objects are directly moving relative to one another, but because spacetime itself is expanding (astronomical redshift, see below) and distorting due to strong gravitational forces (gravitational redshift).
Astronomical Redshift and Hubble's Law
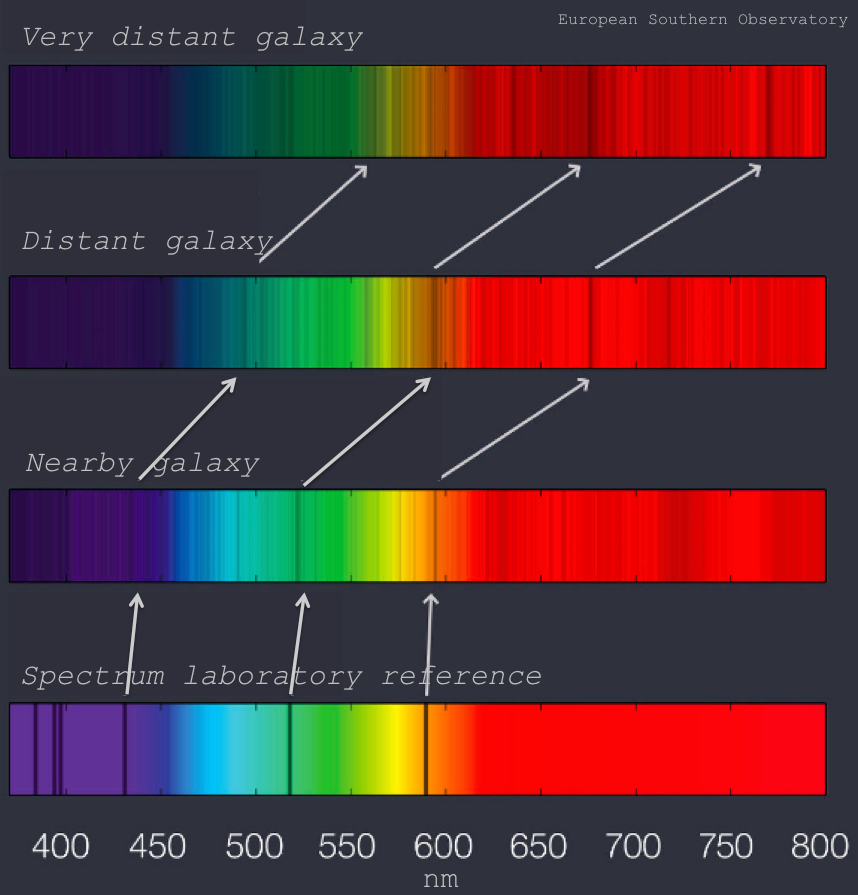
In the early 20th century, the astronomer Edwin Hubble observed that the spectra of distant galaxies were significantly redshifted (such as below). Hubble interpreted this shift in the spectrum as a Doppler shift, postulating that these distant galaxies were traveling away from our own. Hubble eventually determined that the velocity at which these galaxies were receding was proportional to how far away they were; the further away the galaxies were, the higher their redshift was. This equation, Hubble's Law, is written as v = H0d.
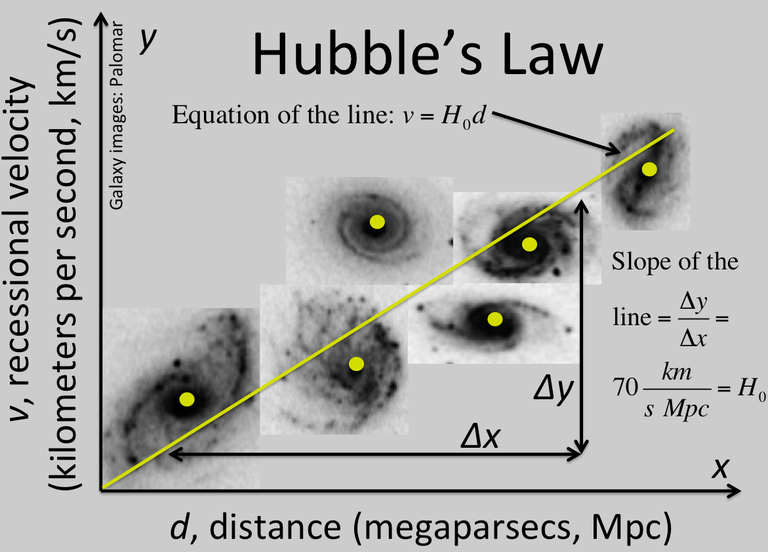
Hubble's Law can be represented graphically by creating a plot of each observed galaxy (see at right). On the x-axis, we plot the distance d of each galaxy (typically in megaparsecs, Mpc), and on the y-axis, we plot the velocity at which it is traveling away, the recessional velocity v (typically in kilometers per second, km/s). The slope of this line is called H0, pronounced H-naught, the Hubble constant, and is typically accepted to have a value of about 70 km/s/Mpc.
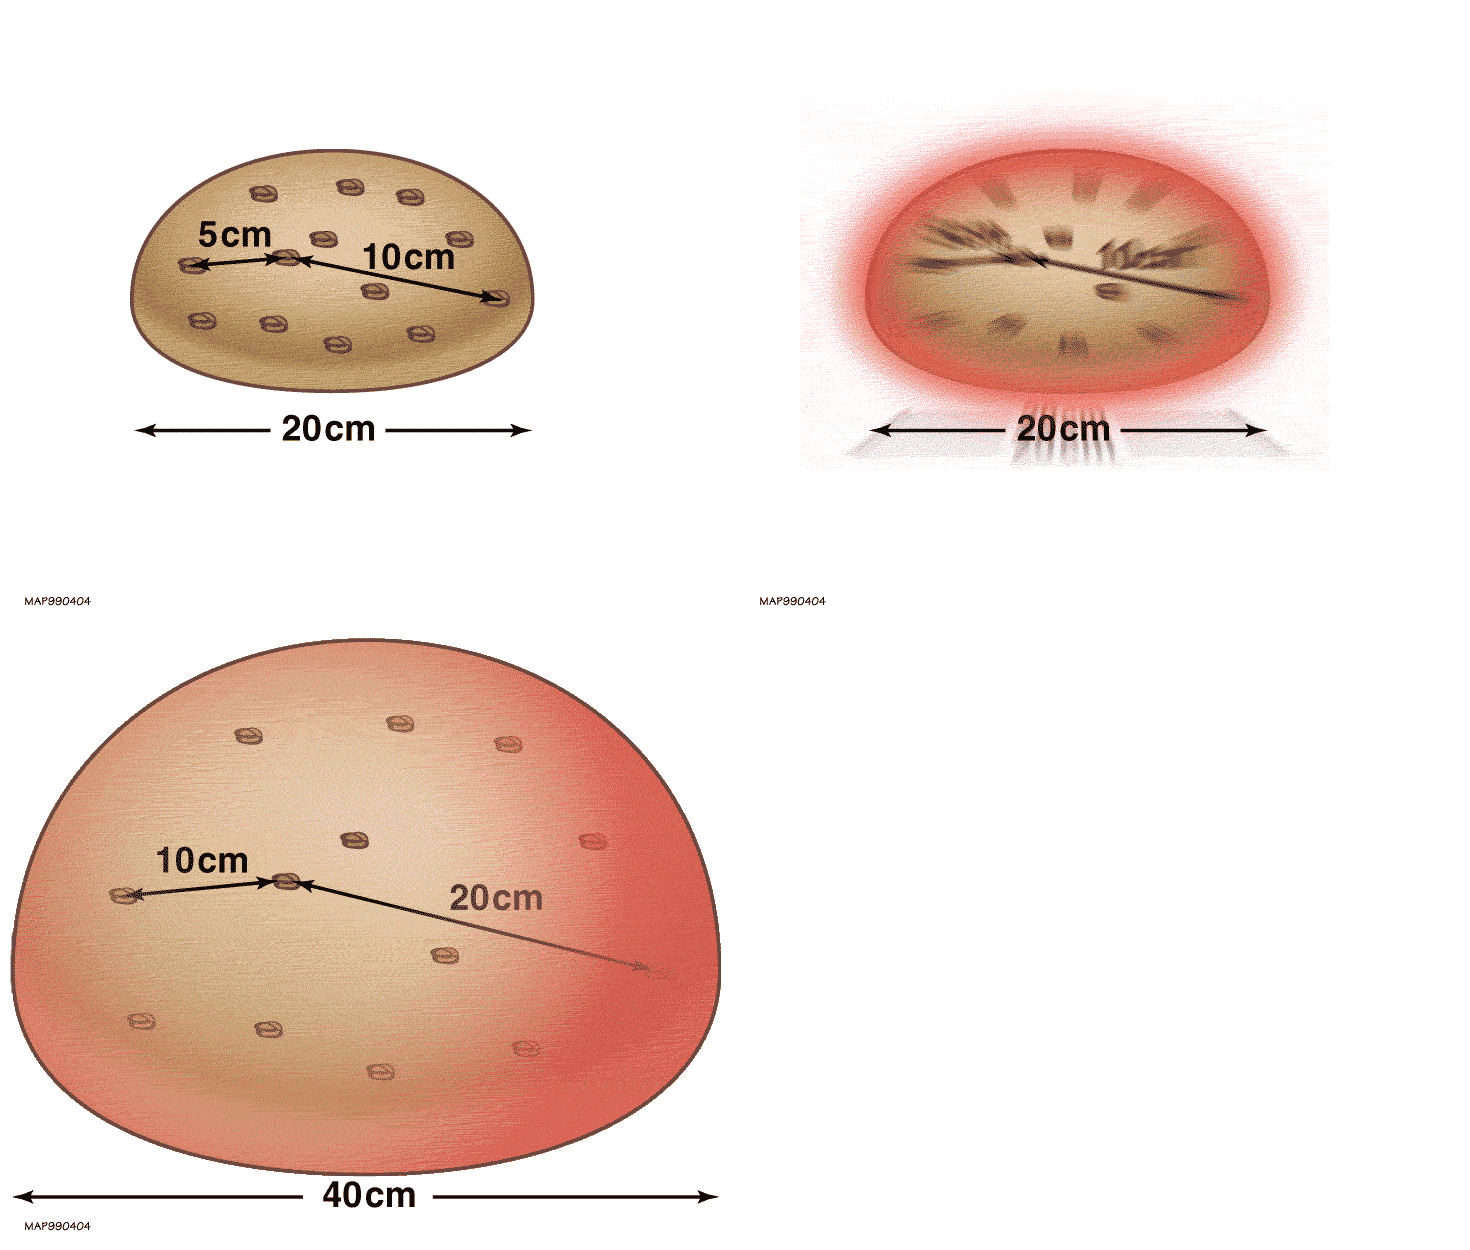
From his observations, Hubble and others were able conclude several important facts about the nature of the Universe. The first comes from noting that all galaxies appear to be receding from our location in space. This is not because the location of the Milky Way is special. Instead, it was realized that this is because the entire Universe is expanding; spacetime itself is stretching apart. Regardless of where observations are made, either in our own Milky Way galaxy or across the Universe in another galaxy, all galaxies appear to be moving away, and the further the galaxy, the faster the rate at which it is moving away. This rate of expansion of the Universe is also speeding up; the Universe is expanding faster than it used to when the Universe was young. You can better understand this expansion of spacetime in the following way: Think of a loaf of raisin bread baking in an oven (see the animation at left). Pretend the loaf is all of the Universe, and the raisins are individual galaxies. As the bread bakes, the loaf expands, and every raisin moves apart from every other raisin. The raisins furthest from each other move away from each other the most quickly. This first conclusion is as follows: if the Universe is always moving apart, rewinding to the early Universe, everything was once compacted into a small point. Everything was densely compacted into a single, hot point before rapidly beginning to expand outward: the moment of the Big Bang.
Furthermore, if we can look at galaxies nearby and far away and see how fast they are receding due to the expansion of spacetime, we have the varying rate for the expansion of the Universe. With the speed of something moving, varying or not, we can work backward to learn when the movement began. From Hubble's observations, we can conclude how long ago the Big Bang occurred; we can estimate the age of the Universe. From this and other methods, the age of the Universe is found to be 13.8 billion years.
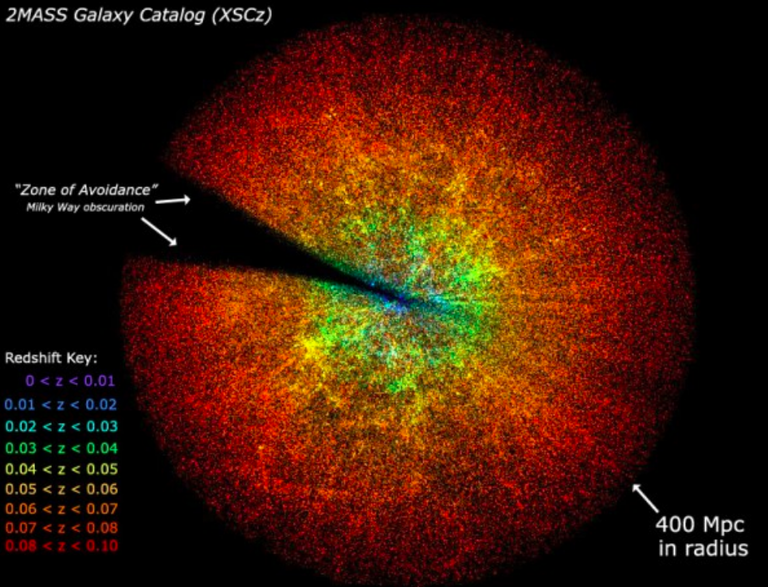
Learning Goals: Students will find the age of the Universe from spectra of galaxies. In the process, they will learn about the expansion of the Universe and how redshift from a spectrum tells a galaxy's recessional velocity. Students will either use archival spectra from the Iowa Robotic Observatory or take their own spectra of distant, non-extended (~1" size) galaxies.