Exercise

In this section, you will use images from your own observation of an open star cluster.

Pick five stars and measure their magnitudes in the B and V filter images. You will need to look up the actual blue and green filter apparent magnitude of a star in the image to calibrate Maxim DL to measure magnitude as you did in the last section. You can use the finder charts provided for the cluster you observed, or you can identify one of the stars in your image using a sky chart program. The B and V magnitude of many stars can also be found in the SIMBAD database.

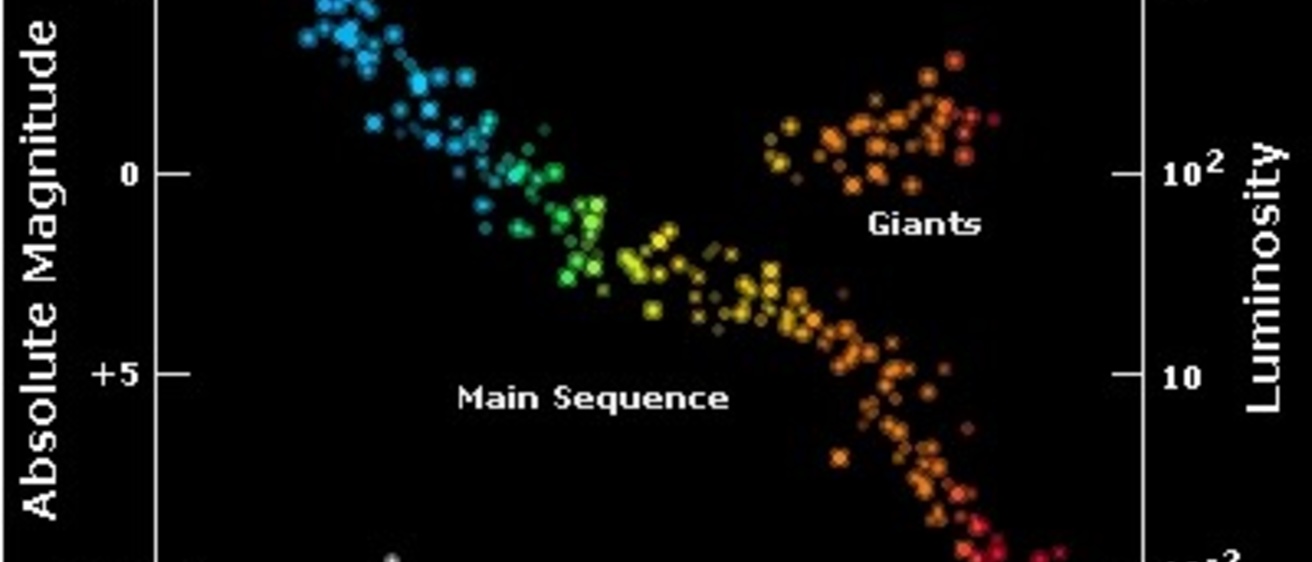
Use the B and G filter magnitudes you found in the color index equation above to determine the temperature of each star. Determine each star's spectral class using the Hertzsprung-Russel diagram below.


The color of a star can be found from its color index, which is just its difference in magnitude when imaged using different colored filters. For example, a star's blue-green color index is its blue (B) filter magnitude minus its green (G) filter magnitude. Astronomers also call the green filter a visual (V) filter, since it corresponds to the middle of the human visual range. Here is an equation for finding approximate surface temperature of a star using its blue-green color index: