
Resources: The Monash University Simple Climate Model
The Monash University Simple Climate Model is based on the model of Dommenget and Floeter 2011 published in the Climate Dynamics journal. The model simulates the climate in way that is simple enough to run on personal computer and yet produces results comparable to those of major climate models. In this second part of the lab, you will use the Monash University Simple Climate Model to deconstruct the impact that different processes on Earth (including the presence of greenhouse gasses) have on the global Climate.
Deconstruct the Mean Climate
On the Monash University Simple Climate Model website linked on the lab webpage, click on ‘Deconstruct the Mean Climate’. When prompted, click ‘Go to Basic version’. This webpage allows you to study the effects that Ice-albedo, Clouds, Oceans, CO2, and the Hydrological cycle (the presence of water vapor in Earth's atmosphere) have on the Earth's climate. This website shows two climate models side by side. All of the processes checked under 'Experiment A' are turned on for the 'Experiment A' model, while all of the processes checked under 'Experiment B' are turned on for the 'Experiment B' model. When changes are made to the processes checked, the user should always make sure to click 'Update Figures', as this is not done automatically. As an example of how the website operates, examine the figure below. Here, all process are turned on in 'Experiment A' and all processes are turned on in 'Experiment B' except for Ice-albedo, the presence of icebergs and polar caps in Earth's oceans. This setup of the two models will allow us to examine the effect of the presence of Ice-albedo on the Earth's climate. Examine the map at the bottom of the website page shown below. The map shows that when Ice-Albedo is present, when the Earth has icecaps, the Earth is generally cooler, especially in the polar regions. (In reverse, if icecaps melt, the Earth warms.) Read below for more details on the use of this part of the website.
In summary, you should setup the page as demonstrated below: All processes are checked under Experiment A, and all processes are checked under Experiment B except for the process you want to study. Remember to click 'Update Figures'. This shows you the effect of the process on the Earth's climate in the bottom map.

[1] Here you can Pause/Play the simulation.
[2] Toggle on and off which processes are in play in 'Experiment A' and 'Experiment B'. To study the effect of a single process, it is highly reccommended that you have all boxes under 'Experiment A' turned on (checked), and all boxes under 'Experiment B' turned on (checked) except for the process you are working to understand the effect of.
[3] Ensure you always click 'Update Figures' after you have added/removed processes.
[4] You can examine the output temperature maps at the top of the page for both 'Experiment A' on the left and and 'Experiment B' on the right, but in general it will likely be easiest to examine the difference map at the bottom of the page, where as the key shows, blue colors indicate 'A colder than B' or the presence of the process makes the climate colder, while red colors indicate 'A warmer than B' or the presence of the process makes the climate warmer.
Puzzles - Climate Elements
On the Monash University Simple Climate Model main webpage, click on ‘Puzzles’ and then click on ‘Climate elements’ under the ‘Beginner level’. Set this puzzle up identically to the 'Deconstruct the Mean Climate' portion of the webpage illustrated in the figure above. Do this by first making sure that all processes are turned on (checked) under both 'Experiment A' and 'Experiment B'. Then, turn off/uncheck just one relevant process under 'Experiment B'. Next, make sure to click 'Update Figures' after you have made a change. Examine the effect of each mystery process A-E on the climate, put the solution into the table, and click 'Submit Solution' to see if you got the answer correct.
Climate change scenarios
On the Monash University Simple Climate Model main webpage, click on ‘Climate change scenarios’. The IPCC SSP5-8.5 CO2-forcing simulation that is brought up by default presents the scenario that would occur if the Earth did not significantly reduce its fossil fuel consumption. The results of the model can be expected if humans do not take significant steps to prevent climate change. The demonstration cycles through the years 1955-2095, displaying a map of the predicted global temperatures. Read below for details on the use of this part of the website.
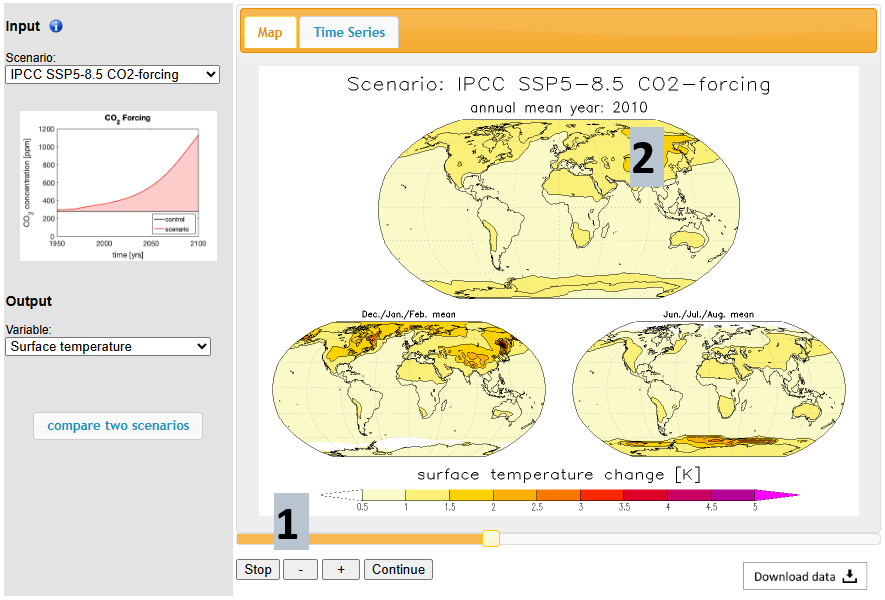
[1] Here you can Pause/Play the simulation.
[2] Compare the map displayed against the key at the bottom of the page to understand the expected global temperatures during the timestamped year. The top map will likely be the most useful to you, though you can also study the mean winter and summer maps given at the bottom.