
This section of the lab will allow you to see a relationship between wavelength and colors of visible light and will help you become familiar with the Vernier Emissions Spectrometer.

There is a small black box on your lab table that has small lights of different colors that can be turned on in sequence. We will use the spectrometer to study the wavelengths of these lights. To set up:
- Connect the spectrometer to your lab computer using the USB cable provided.
- Next, take the red cap off the front of the spectrometer (be sure not to lose this).
- Remove the Vernier Emissions Fiber from its bag and remove the plastic caps on either end (be sure not to lose these either).
- Place one end of the fiber into the front of the spectrometer, and twist to the right to secure the connection.
- Open Logger Pro on your lab computer and click the rainbow-colored button in the top left corner (which says "Set Up Sensors").
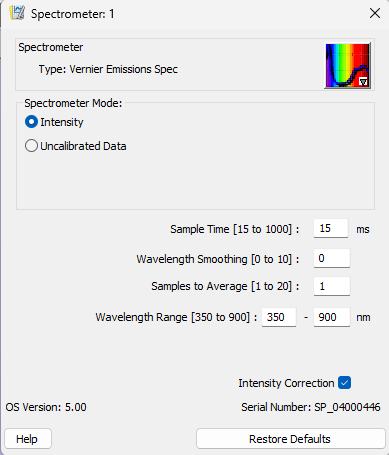
- The following screen should pop up, make sure your settings match. You will need to check the box for "intensity correction".
7. Finally, right click on the graph and select "Graph Options". Then in the Appearance section, check the box that says "draw visible spectrum (wavelength graph)". This will allow you to see which colors correspond to each wavelength on the graph.
8. Now you are ready to record! Hold the other end of the optical fiber up to the light source you want to measure and click "Collect". Logger Pro will display a wavelength vs. intensity plot of whatever light source the optical fiber is pointed at.